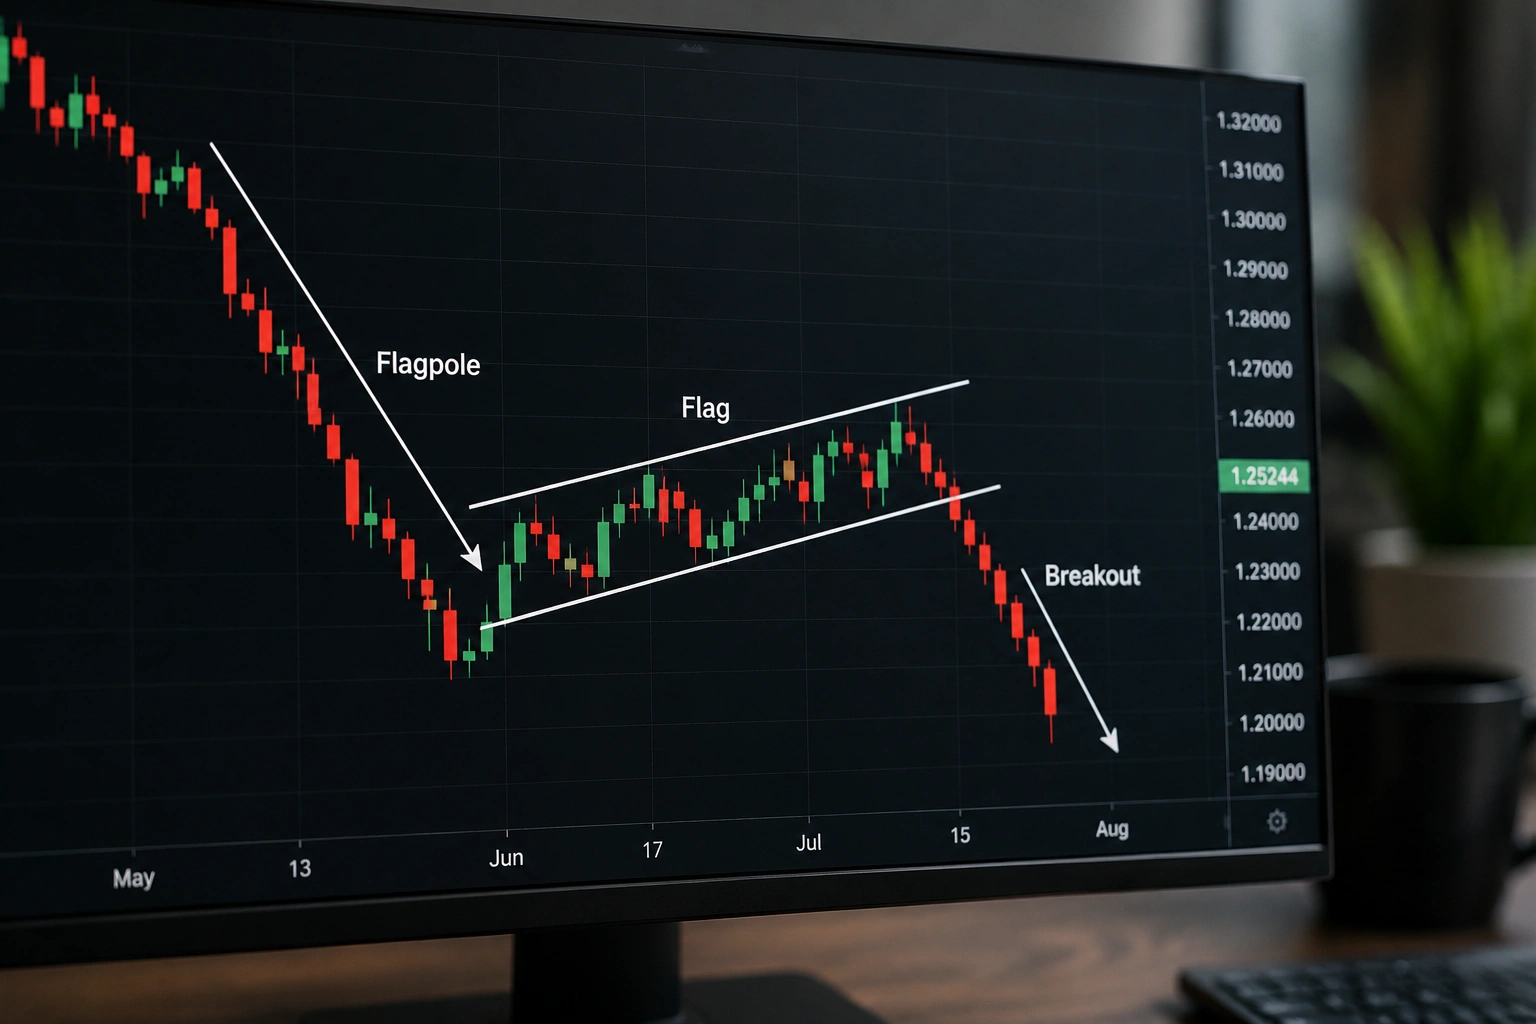
The bear flag pattern is a popular technical analysis formation that can signal a possible continuation of a downtrend. It appears after a strong price decline, followed by a short period of consolidation. During this pause, the price often moves slightly upward or sideways as buyers attempt to recover some losses.
The setup looks simple, but traders need more than its shape to judge its quality. Volume, market direction, support levels, and the strength of the initial decline can all provide useful context. For beginners, learning how the pattern develops can make bearish chart setups easier to understand. It can also help traders distinguish a genuine continuation setup from an ordinary price bounce.
What Is a Bear Flag Pattern?
A bear flag pattern is a bearish continuation formation that develops during an existing downtrend. It begins with a sharp decline known as the flagpole. After the decline, the market pauses and forms a smaller consolidation area. This area often slopes slightly upward against the main trend.
The upward movement does not necessarily mean buyers have taken control. Instead, it may represent temporary profit-taking by sellers and buying from traders expecting a rebound. If selling pressure returns, the price can break below the lower boundary of the consolidation. Traders often watch this breakdown as a potential signal that the previous downtrend may continue.
Simple Bear Flag Pattern
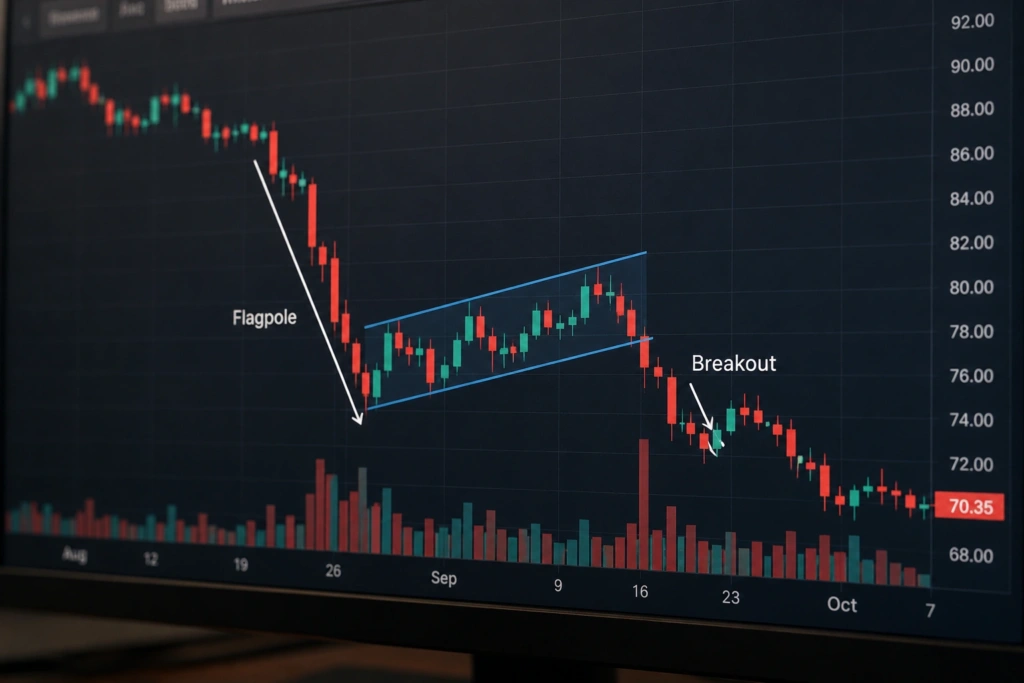
This simple illustration shows the basic structure. The steep decline creates the flagpole, while the smaller upward channel forms the flag. A move below the lower boundary represents the potential bearish breakdown.
How Does a Bear Flag Form?
The formation usually begins when sellers take strong control of the market. A company may report weak earnings, an industry may face new pressure, or investors may react to broader economic concerns. Whatever the reason, aggressive selling pushes the asset sharply lower and creates the flagpole.
After the initial decline, the selling pressure temporarily weakens. Some sellers close positions and take profits, while buyers enter because the asset now appears cheaper. Price may then move gradually higher inside a narrow channel. If buyers cannot create a stronger reversal, sellers may return. A break below the flag’s support can then indicate that bearish momentum is returning.
How to Identify the Pattern
Start by looking for a clear downward move. The flagpole should stand out on the chart rather than representing a series of tiny declines. A strong initial move gives the pattern its bearish context and shows that sellers had meaningful control before consolidation began.
Next, examine the consolidation area. Price should generally move upward or sideways in a relatively controlled manner. You can draw two trendlines around the swing highs and lows to define the flag. The setup becomes more interesting when price breaks below the lower trendline with convincing momentum. Traders can also compare the structure with a support and resistance guide to identify important levels around the formation.
Volume and Bear Flag Confirmation
Volume can provide useful information when analyzing a potential setup. The flagpole may develop alongside strong trading activity because many market participants are selling. During consolidation, volume often decreases as the market pauses and traders wait for the next directional move.
A downside breakout accompanied by increasing volume can provide stronger confirmation than a breakdown that occurs on very weak activity. Still, volume should never act as the only reason to enter a trade. Earnings announcements, economic releases, and sudden market news can cause unusual volume. Looking at price action and volume together gives traders a more complete picture.
How to Trade a Bear Flag Pattern
Traders use several approaches when dealing with a potential breakdown. Some enter after the price closes below the lower trendline. Others wait for a breakout retest strategy, where the price returns toward the broken support before continuing lower. The second approach can offer additional confirmation, but the market may also continue falling without providing a retest. For more: Most Volatile Stocks: Risks, Metrics & Strategies
Risk management matters regardless of the entry method. A stop-loss can be placed above a technically meaningful resistance level or another area that would invalidate the bearish setup. Position size should reflect the distance between the entry and stop. For example, a volatile cryptocurrency may require a wider stop than a stable large-cap stock. The goal is to manage the trade logically rather than react emotionally.
Bear Flag Price Target
One common technique for estimating a potential target involves measuring the flagpole. Traders calculate the distance between the beginning of the sharp decline and the low reached before consolidation. They then project a similar distance downward from the breakdown area.
Consider a stock that falls from $100 to $80 before forming a flag. The flagpole measures $20. If the price later breaks below the flag at $85, the measured-move approach would produce a potential target near $65. This calculation is only an estimate. Previous support, market sentiment, and new information can cause the price to stop well before reaching the projected level. Traders should therefore treat measured targets as planning tools, not guaranteed outcomes.
Bear Flag vs. Bull Flag
The bear flag and bull flag have similar structures, but they develop in opposite market directions. A bear flag follows a strong decline and may lead to a downside continuation. A bull flag follows a strong rally and may lead to an upside continuation.
The key difference is the direction of the flagpole and the expected breakout. Traders should also consider the larger trend rather than focusing only on the consolidation shape. A small upward channel after a major decline can support a bearish interpretation, while a similar channel after a strong rally can represent a bullish setup. Learning both formations can improve chart-reading skills, especially when combined with a bull flag pattern guide.
Common Mistakes to Avoid
One frequent mistake is labeling every small bounce after a decline as a bear flag. The broader structure matters. Without a meaningful preceding downtrend, a similar-looking consolidation may simply represent normal market movement.
Another mistake involves entering before confirmation. Price can break upward from the flag and invalidate the bearish idea. Traders should also avoid relying on a single indicator. A better approach considers price structure, volume, nearby support, market conditions, and the asset’s volatility. Most importantly, no chart pattern guarantees a specific outcome. Even a well-formed setup can fail unexpectedly.
Frequently Asked Questions
Is the bear flag pattern bullish or bearish?
It is generally considered a bearish continuation pattern. It appears after a decline and suggests that selling pressure may return after consolidation.
How do you confirm a bear flag?
A common confirmation occurs when price breaks and closes below the lower boundary of the flag. Stronger volume can provide additional confirmation.
How accurate is the bear flag pattern?
Its reliability varies with market conditions and the quality of the setup. No technical pattern works every time, so traders should use confirmation and risk management.
What is the target of a bear flag?
Many traders measure the flagpole and project a similar distance from the breakdown point. This creates a potential target rather than a guaranteed price level.
Can a bear flag fail?
Yes. Price may break above the flag or move below support and quickly reverse. False breakouts are a normal risk when trading chart patterns.
Conclusion
The bear flag pattern can help traders recognize a potential continuation of a bearish trend. Its structure consists of a strong decline, a short consolidation, and a possible breakdown below support. Volume and market context can help traders judge whether the setup has meaningful confirmation.
However, the pattern should not be treated as a guaranteed prediction. Price can reverse at any stage, especially when unexpected news changes market sentiment. Traders who combine chart structure with volume analysis, support and resistance, sensible position sizing, and disciplined risk management can make more informed decisions. For a broader technical analysis toolkit, consider exploring related guides on chart patterns, trendline trading, and support and resistance.