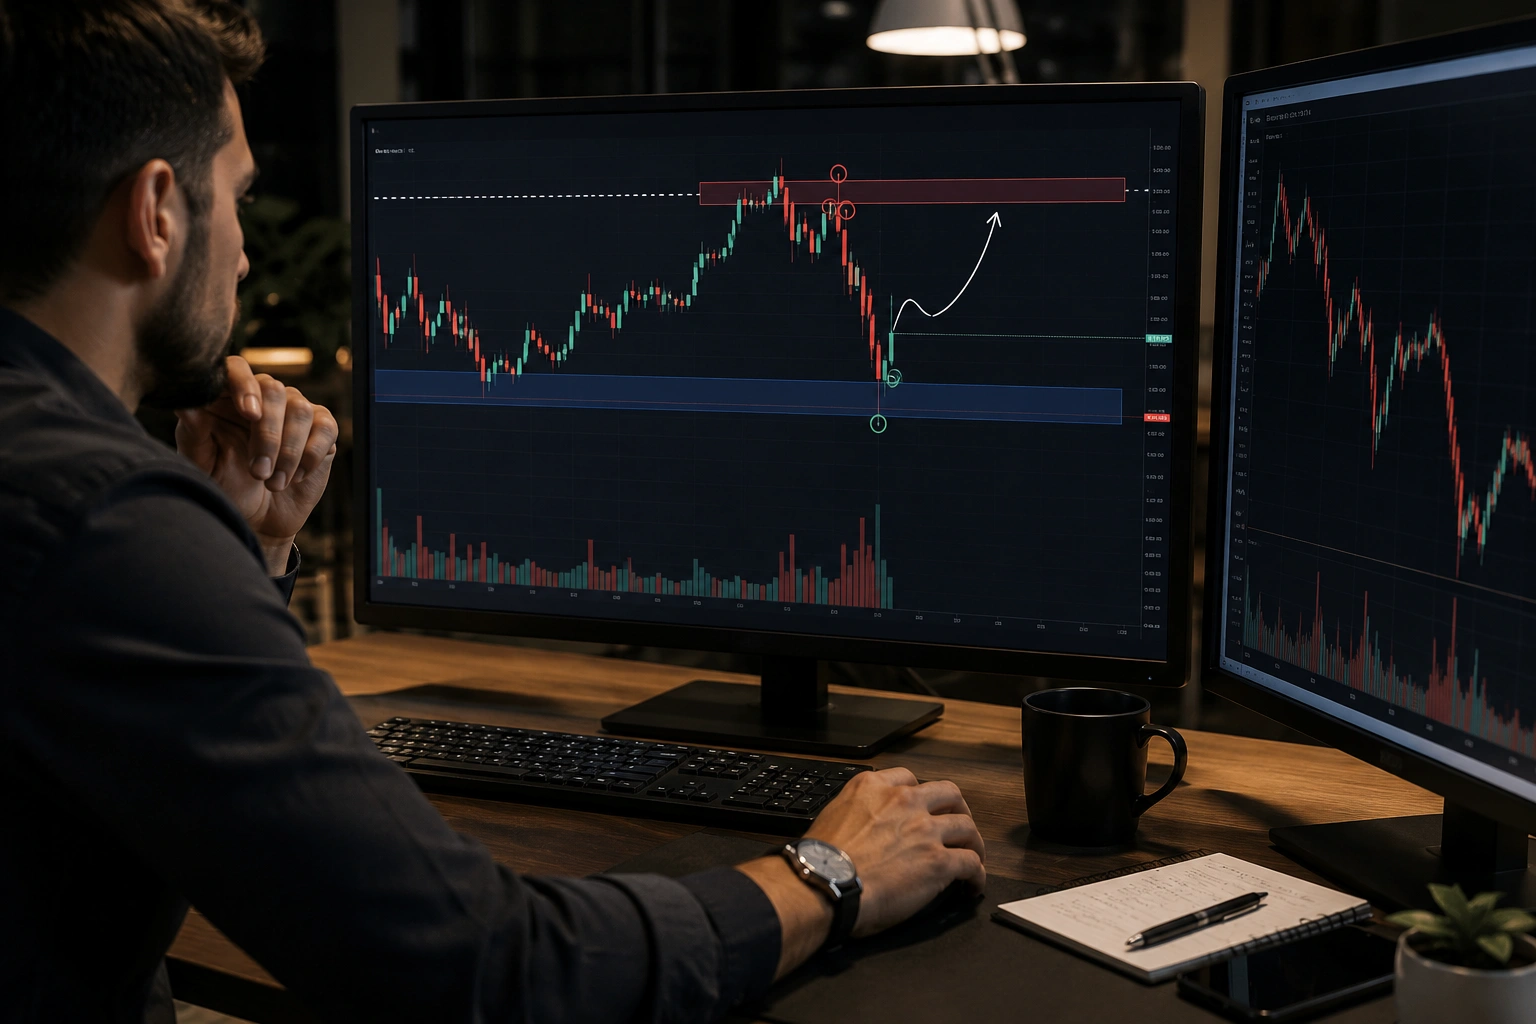
A liquidity sweep is a price action concept that traders use to understand movements around important highs and lows. It happens when price moves beyond a visible level and then quickly returns back inside the previous range. Many traders connect this behavior with stop-loss orders and pending orders around obvious market levels. A liquidity sweep can appear above a previous high or below a previous low. Traders often study these moves when looking for possible reversals or changes in market direction. However, not every move beyond a high or low becomes a successful reversal. Understanding market structure, trading volume, volatility, and confirmation can help traders interpret these situations more carefully.
The concept has become popular among traders who study liquidity, institutional trading ideas, and price action. The basic principle is easy to understand. Markets often move toward areas where many orders may exist. Previous highs and lows can attract attention because traders commonly place stops around these levels. When price reaches such an area, it may briefly move beyond the level before reversing. This movement can create a liquidity sweep. Traders then watch the reaction to determine whether the move was a genuine breakout or a possible liquidity grab. Learning this distinction can improve chart analysis and reduce the risk of entering trades too early.
What Is a Liquidity Sweep?
A liquidity sweep occurs when price moves beyond an obvious high or low and then reverses or returns toward the previous trading area. Traders often call this movement a liquidity grab because price may trigger orders around the level before changing direction. For example, imagine a market has a clear resistance level formed by a previous high. Many traders may place stop-loss orders above that high. If price briefly rises above the level and then falls back below it, traders may identify the movement as a potential liquidity sweep. The same idea can happen below support when price moves beneath a previous low and then returns above it.
The important detail is the reaction after the level breaks. A simple breakout does not automatically qualify as a liquidity sweep. If price moves above resistance and continues rising with strong momentum, the market may simply be experiencing a genuine breakout. A sweep usually involves a failure to sustain the move beyond the previous level. Traders therefore study what happens after the initial breakout. They may look for rejection, displacement, or a market structure shift. This makes market structure analysis an important related topic. By combining the sweep with broader price action, traders can develop a more complete view of what the market may be doing.
How Does a Liquidity Sweep Work?
Markets contain different types of orders, including stop orders, limit orders, and market orders. Traders often place stop-loss orders near obvious swing highs and lows. These areas can therefore contain clusters of potential liquidity. When price approaches such a level, increased order activity can occur. A liquidity sweep may happen when price moves through the level and triggers some of these orders. Afterward, price may reverse if the market fails to maintain momentum beyond the level. Traders watch this sequence because it can reveal how price reacts around areas where many market participants may have positioned their orders.
Consider a stock that repeatedly struggles to move above $100. Traders notice the level and place stop-loss orders or breakout orders around it. During the next session, price rises to $101 and then quickly falls back below $100. The move above $100 may have triggered orders before the reversal began. A trader studying price action could identify this event as a potential liquidity sweep. However, the trader should not assume a reversal simply because price crossed the level. Confirmation remains important. A strong rejection followed by a break in short-term market structure may provide better evidence than the sweep alone.
Buy-Side Liquidity Sweep
A buy-side liquidity sweep occurs when price moves above a previous high and then reverses lower. Buy-side liquidity often refers to orders positioned above previous highs. These can include stop-loss orders from traders holding short positions and breakout orders from traders expecting price to continue upward. When price moves above the high, those orders may activate. If the market then fails to hold above the level, traders may view the movement as a potential buy-side liquidity sweep. The setup often attracts attention around major swing highs, equal highs, or clearly visible resistance areas.
For example, suppose an index forms two similar highs during a trading session. Traders can easily see this resistance area on the chart. Later, price moves slightly above both highs before quickly falling back below them. The move may have taken liquidity above the equal highs. Traders can then monitor the next price reaction. If the market creates a lower high and breaks a nearby swing low, the bearish case becomes stronger. This example shows why traders should focus on the entire sequence instead of the initial price spike. Understanding equal highs and equal lows can also help traders identify areas where liquidity may gather.
Sell-Side Liquidity Sweep
A sell-side liquidity sweep happens when price moves below a previous low and then returns above that level. Sell-side liquidity can exist below obvious lows because traders may place stop-loss orders beneath those levels. Short sellers may also enter when price breaks support. If price quickly moves below the low and then reverses upward, traders may interpret the movement as a possible sell-side liquidity sweep. This setup often appears near swing lows, equal lows, or clearly visible support areas. The reaction after the sweep remains more important than the level break itself. For more: SMT Divergence: A Complete Guide for Traders
Imagine that a currency pair forms a clear support level around 1.1000. Several traders watch the same area. Price later falls to 1.0990 and then quickly climbs back above 1.1000. The move below support may have triggered sell-side liquidity before buyers pushed price higher. A trader can then watch for a bullish structure shift. If price breaks a nearby lower high and continues upward, the sweep gains stronger confirmation. Still, the market can continue lower after a sweep. Traders should therefore use predefined rules and risk management rather than assuming every sell-side sweep will produce a bullish reversal.
Liquidity Sweep and Market Structure
Market structure helps traders understand whether a liquidity sweep has meaningful follow-through. Price normally creates a sequence of highs and lows during a trend. An upward trend often produces higher highs and higher lows. A downward trend usually creates lower highs and lower lows. When a sweep occurs, traders can observe whether the following price action changes this structure. A bearish sweep above a high becomes more interesting when price later breaks a meaningful higher low. A bullish sweep below a low can become more relevant when price breaks a nearby lower high. This relationship gives the sweep a clearer context.
The timing of the structure shift also matters. A tiny movement after the sweep may not provide enough evidence of a genuine change. Traders often prefer a clear displacement or decisive break of a relevant swing point. For example, price may sweep a previous low and immediately move upward. If it then breaks the last short-term lower high with strong momentum, traders may see stronger bullish confirmation. The same principle applies to bearish setups. A sweep above a high followed by a clear break of structure can strengthen the bearish interpretation. Studying market structure shifts alongside liquidity concepts can therefore improve chart reading.
Liquidity Sweep vs Breakout
A liquidity sweep and a genuine breakout can initially look very similar. In both situations, price moves beyond a previous high or low. The main difference appears in what happens afterward. During a genuine breakout, price usually holds beyond the level and continues in the breakout direction. During a potential liquidity sweep, price fails to maintain the move and returns toward the previous range. Traders therefore need to observe follow-through rather than judging the setup from the first breakout candle.
Suppose a stock trades below support and continues falling for several candles. The move may represent a genuine bearish breakout rather than a sweep. In another situation, price briefly moves below support but quickly returns above it. If buyers then create strong upward momentum, the second example may fit a liquidity sweep more closely. This distinction can help traders avoid confusing failed breakouts with normal continuation. Tools such as support and resistance, market structure, and volume analysis can provide additional context. No single feature should determine the entire trade decision.
Why Do Liquidity Sweeps Happen?
Liquidity sweeps can occur because many traders focus on the same obvious price levels. Previous highs and lows are easy to identify, so they often attract stop-loss and breakout orders. When price reaches these areas, a larger number of orders may become active. The resulting movement can push price temporarily beyond the level. If the market does not find enough support for continued movement, price may return to the previous range. This behavior can create the appearance of a sudden stop hunt or liquidity grab. Traders study these events to understand how price interacts with concentrated order areas.
Market conditions also influence how these movements develop. During highly volatile sessions, price can move through several important levels within a short period. Economic announcements can create especially sharp moves. A sweep during quiet market conditions may behave differently from one during a major news release. Traders should therefore consider the trading session, volatility, broader trend, and nearby technical levels. For example, a sweep near a major daily high may have more context than a small movement around a minor intraday level. Understanding market volatility can help traders interpret liquidity events more realistically.
How to Identify a Liquidity Sweep
Identifying a liquidity sweep requires more than spotting a candle that crosses a previous high or low. Traders should first mark obvious swing points on the chart. These levels may include previous session highs, previous session lows, equal highs, equal lows, or major support and resistance zones. Next, observe how price approaches the level. A sudden move through the level followed by a quick rejection can create a potential sweep. Traders should then wait for additional price action before deciding whether the event has real significance.
A simple process can make chart analysis more consistent:
- Mark important highs and lows.
- Identify areas where liquidity may gather.
- Watch for price to move beyond those levels.
- Observe whether price quickly returns.
- Look for market structure confirmation.
- Define risk before considering an entry.
This process can help traders avoid impulsive decisions. A liquidity sweep should become part of a broader trading plan rather than a standalone entry signal. Traders can also record historical examples in a trading journal. Reviewing these examples can reveal how different markets respond after liquidity events. Over time, this practice can improve pattern recognition and help traders understand which setups fit their strategy.
Common Liquidity Sweep Mistakes
One common mistake is assuming every break of a high or low represents a liquidity sweep. Markets regularly break important levels and continue trending. A trader who labels every breakout as a sweep may miss genuine continuation moves. Another mistake involves entering immediately after price crosses the level. The market may still continue in the breakout direction. Traders should wait for the reaction and use clear confirmation rules. This approach reduces the chance of making decisions based on the first movement alone.
Another mistake involves ignoring the larger trend. A sweep against a powerful trend may not produce a major reversal. Traders should also consider the timeframe. A small sweep on a one-minute chart may have little influence on a daily trend. Poor risk management can create another problem. Even a well-structured sweep can fail. Traders should therefore define their invalidation level and position size before entering. Keeping a trading journal can help identify repeated errors and improve decision-making. Reviewing both successful and failed setups provides a more realistic understanding of how liquidity sweeps behave.
Benefits and Limitations of Liquidity Sweeps
One benefit of studying liquidity sweeps is that they encourage traders to focus on important price levels. Instead of reacting to every candle, traders can examine areas where previous highs, lows, and order activity may influence price. The concept also works well with market structure and price action analysis. A sweep can highlight a potential area of interest before a trader looks for confirmation. This can help create a more structured trading process. It may also help traders understand why some breakouts fail after briefly moving beyond obvious support or resistance.
However, liquidity sweeps have clear limitations. They do not guarantee reversals, profitable trades, or accurate market predictions. A market can sweep a level and continue strongly in the same direction. Correlation, volatility, news, and timeframe can all affect the outcome. Traders should therefore avoid relying on the pattern alone. Historical testing can help determine how a particular strategy performs across different conditions. Beginners can also use simulated trading to practice identifying setups. The goal should be to understand the context behind a sweep rather than simply memorizing a visual pattern. Risk management remains essential regardless of the setup.
How to Trade a Liquidity Sweep
A structured approach begins with preparation. Mark important highs and lows before looking for potential setups. Identify whether the market currently shows an upward, downward, or sideways structure. Then watch for price to move beyond an obvious level. If price quickly returns, consider whether the movement could represent a liquidity sweep. Do not enter solely because the level has been taken. Instead, wait for the confirmation required by your trading plan. This may include a market structure shift, strong rejection, or displacement in the opposite direction.
Risk management should guide the execution process. Decide where the trade becomes invalid before entering. Position size should reflect the amount of risk you are willing to accept. Avoid moving your stop-loss simply because the market moves against your position. It is also useful to record each setup in a journal. Note the liquidity level, market structure, entry reason, confirmation, and outcome. This information can help you evaluate your strategy over time. Traders can also study related topics such as price action trading, market structure, and support and resistance to build a broader technical framework.
FAQ
What is a liquidity sweep?
A liquidity sweep occurs when price moves beyond an obvious high or low and then returns toward the previous range.
Is a liquidity sweep a reversal signal?
Not always. Traders usually wait for additional confirmation before treating a sweep as a possible reversal setup.
What is a buy-side liquidity sweep?
It happens when price moves above a previous high and then reverses lower. Traders often associate it with liquidity above that high.
What is a sell-side liquidity sweep?
It occurs when price moves below a previous low and then returns higher. Traders often watch for bullish confirmation afterward.
How can beginners learn liquidity sweeps?
Beginners can study historical charts, mark important highs and lows, and practice identifying sweeps alongside market structure and risk management.
Conclusion
A liquidity sweep is a useful price action concept for understanding movements around important highs and lows. It occurs when price moves beyond a visible level and then fails to maintain that move. Traders often study these events around previous highs, previous lows, equal highs, and equal lows.
The strongest analysis comes from combining the sweep with market structure, liquidity, price action, and proper risk management. A sweep alone cannot guarantee a reversal or profitable trade. If you want to develop this skill, practice on historical charts and keep a detailed trading journal. This can help you recognize meaningful setups and make more disciplined trading decisions over time.