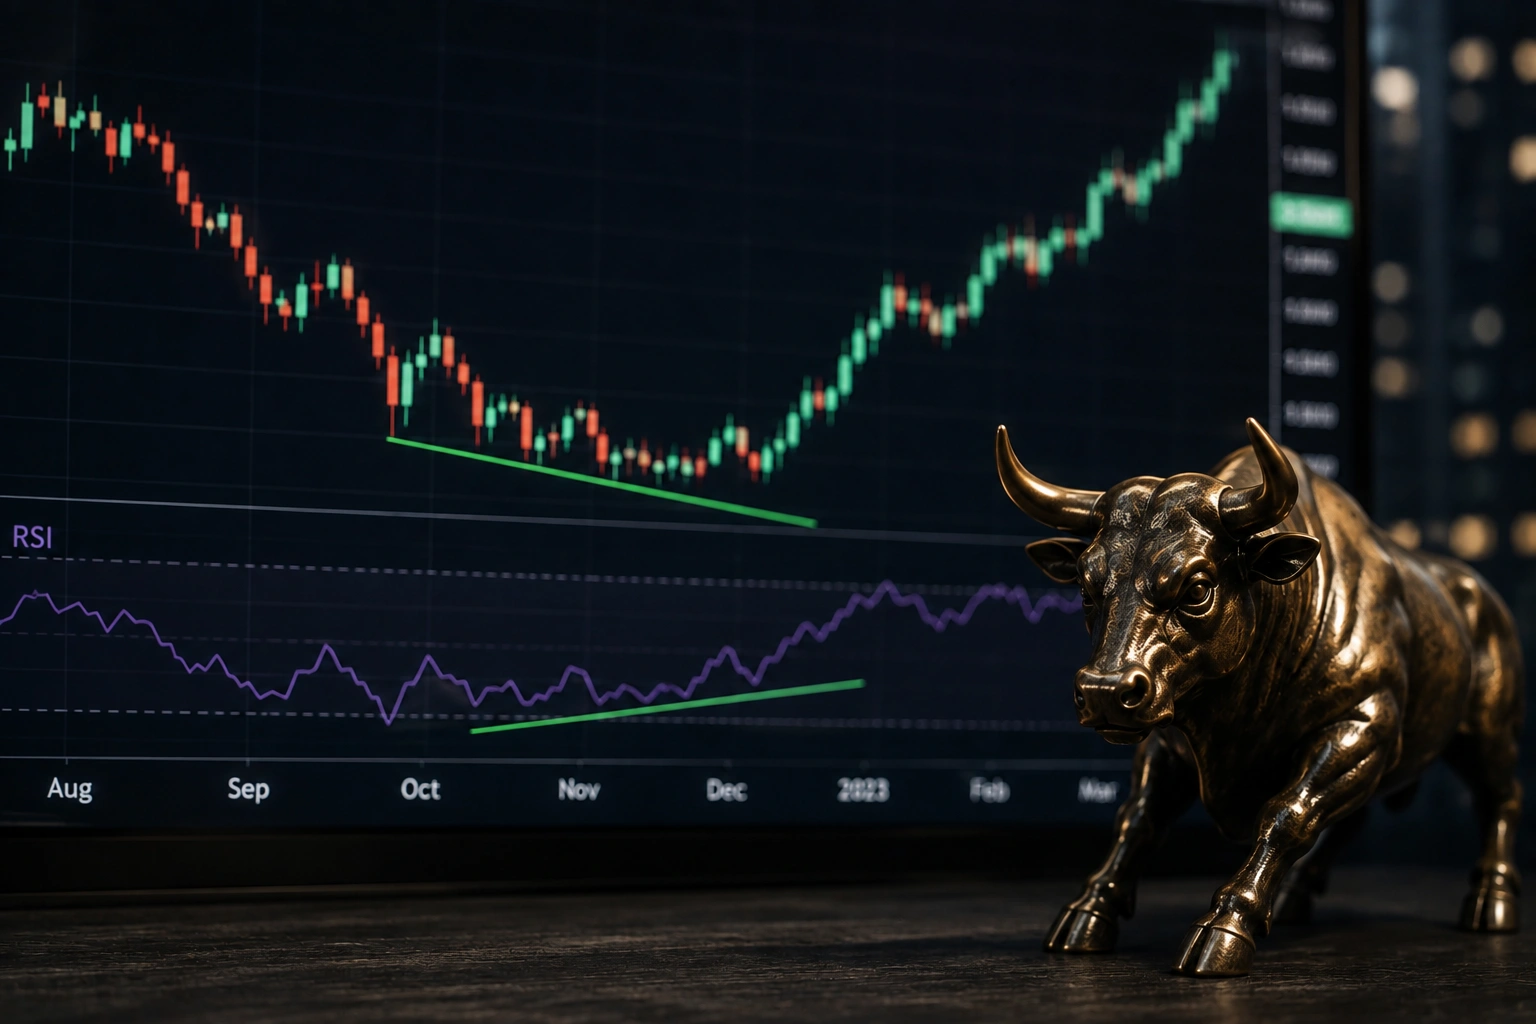
Bullish divergence is a technical analysis signal that can suggest weakening downward momentum and a possible change in price direction. It occurs when an asset’s price creates a lower low while a momentum indicator forms a higher low. This difference can indicate that selling pressure is losing strength, even though the price is still falling. Traders commonly look for this setup on indicators such as the Relative Strength Index (RSI), Moving Average Convergence Divergence (MACD), and Stochastic Oscillator. However, divergence is not a guaranteed reversal signal. It is better viewed as a warning that momentum may be changing and should be confirmed with price action, volume, support levels, or other technical signals before a trade is considered.
What Is Bullish Divergence?
Bullish divergence happens when price and a momentum indicator move in opposite directions during a decline. The classic setup appears when the market makes a lower low, but the indicator makes a higher low. Price is therefore showing continued weakness, while the indicator suggests that downward momentum is becoming less powerful.
Imagine a stock falls from $100 to $85 and later drops to $80. If the RSI was lower at the first price low but is higher when the stock reaches $80, a bullish divergence has formed. The price has made a new low, but momentum has not. This can be an early clue that sellers are losing control. Experienced traders generally do not treat this pattern alone as a buy signal. Instead, they wait for additional evidence, such as a break above resistance or a strong reversal candle. A useful internal resource here is a beginner’s guide to technical analysis for understanding how momentum indicators fit into a broader trading process.
How Bullish Divergence Works
The basic idea behind bullish divergence is that price represents the market’s current value, while momentum indicators measure the strength or speed of that movement. When price reaches a new low but the indicator does not confirm that weakness, the relationship between price and momentum has changed.
This does not necessarily mean the market must immediately rise. A divergence can remain visible while an asset continues falling, sometimes for an extended period. For this reason, traders often describe divergence as a potential warning rather than a standalone entry signal. For example, a cryptocurrency might fall from $60,000 to $55,000 and then to $51,000, while its RSI moves from 25 to 30 between the corresponding lows. The higher RSI low suggests improving momentum, but price confirmation is still needed. Combining divergence with support and resistance analysis can provide a more complete view of the setup.
Regular Bullish Divergence vs Hidden Bullish Divergence
Regular Bullish Divergence
Regular bullish divergence is the most commonly discussed form. It occurs when price makes a lower low while the momentum indicator makes a higher low. Traders often interpret this pattern as evidence that bearish momentum may be weakening and that a potential bullish reversal could develop.
The setup becomes more meaningful when it appears near an established support zone or after a prolonged decline. For instance, if a stock repeatedly finds buyers near a previous support level and simultaneously creates regular bullish divergence on the RSI, traders may watch for confirmation of a reversal. Confirmation might include a higher high, a break of a short-term trendline, or increasing buying volume. The divergence itself does not establish that a bottom has formed. Understanding this distinction is important because markets can remain oversold or divergent while prices continue moving lower.
Hidden Bullish Divergence
Hidden bullish divergence has a different structure and is often associated with the continuation of an existing uptrend. In this setup, price makes a higher low while the momentum indicator makes a lower low. Instead of primarily warning about a potential reversal, the pattern can suggest that bullish momentum may resume after a temporary correction.
For example, suppose a stock rises from $50 to $70, pulls back to $60, and then begins stabilizing. If the price’s correction produces a higher low but the RSI makes a lower low, hidden bullish divergence may appear. Traders may interpret this as a possible continuation signal when the broader trend remains bullish. Like regular divergence, however, hidden divergence should be considered alongside market structure, support, resistance, volume, and broader trend conditions rather than used in isolation.
How to Identify Bullish Divergence on a Chart
Finding bullish divergence requires comparing at least two meaningful price lows with the corresponding lows on a momentum indicator. The key is to compare similar swing points rather than randomly selected candles. A clean chart structure usually makes the relationship easier to recognize. For more: Green Energy Stocks: A Beginner’s Investment Guide
A practical identification process can include the following steps:
- Find two significant swing lows in the asset’s price.
- Check whether the second price low is lower than the first.
- Compare the same two points on an indicator such as RSI or MACD.
- Look for the indicator forming a higher low.
- Wait for price confirmation before treating the setup as a potential trade opportunity.
The timeframe also matters. A divergence visible on a five-minute chart may have less significance for a long-term investor than one appearing on a weekly chart. Traders should therefore choose a timeframe that matches their strategy. Using the same process across several timeframes can also help distinguish a short-term fluctuation from a potentially broader change in momentum.
Bullish Divergence With RSI
The RSI is one of the most popular tools for identifying bullish divergence because it measures momentum on a scale from 0 to 100. Traders compare RSI lows with corresponding price lows to determine whether momentum is confirming the decline.
Suppose an index falls to 4,000 and its RSI reaches 24. The index later drops to 3,900, but the RSI rises to 31. Price has established a lower low, while RSI has formed a higher low. This is a classic bullish divergence. The setup may become more interesting if the second low occurs around a historically important support area. Still, RSI divergence does not predict exactly when a reversal will happen. An asset can remain weak after the divergence appears, so traders commonly wait for a price trigger before entering a position.
Bullish Divergence With MACD
The MACD is another widely used indicator for studying momentum and potential trend changes. Traders can look for bullish divergence by comparing lower lows in price with higher lows in the MACD line or related MACD structure.
One advantage of combining MACD divergence with price analysis is that traders can observe both momentum and trend behavior. For example, if a stock makes a new low but the MACD records a less negative low, bearish momentum may be weakening. A later bullish MACD crossover can provide additional confirmation, although it may occur after part of the potential move has already started. Traders should also remember that MACD is generally more responsive to broader price movements than very short-term oscillators, making the timeframe and market conditions important when interpreting the signal.
Bullish Divergence in Different Markets
Bullish divergence can appear across many liquid markets, including stocks, forex, cryptocurrencies, commodities, and market indexes. The underlying principle remains the same: price creates a lower low while the selected momentum indicator creates a higher low. What changes is the market environment surrounding the signal.
In highly volatile markets such as cryptocurrency, divergence can appear frequently and may produce false signals during sharp sell-offs. In stocks, earnings announcements or major company news can overwhelm a technical pattern. In forex, central-bank decisions and economic data can cause sudden moves that invalidate a setup. This is why experienced traders consider market context before acting. A divergence occurring near major support during a stable market can have a very different meaning from one appearing during a major news-driven decline.
How Traders Confirm Bullish Divergence
Confirmation is one of the most important parts of using divergence responsibly. Instead of buying as soon as a divergence appears, traders may wait for evidence that price has actually started changing direction. The exact confirmation method depends on the trading strategy and timeframe.
Common confirmation signals include:
- A break above a short-term resistance level.
- A higher high following the second price low.
- A bullish reversal candlestick pattern.
- Increasing trading volume during the upward move.
- A trendline breakout.
- A supportive signal from another momentum or trend indicator.
Consider a stock that forms bullish divergence near $40 support. Rather than immediately buying at $40, a trader might wait until the stock moves above a nearby resistance level at $43 with stronger volume. This approach can reduce the chance of entering during a continuing decline, although it cannot eliminate trading risk. A related guide to support and resistance can help beginners understand why these confirmation levels matter.
Common Mistakes When Trading Bullish Divergence
One common mistake is assuming that every bullish divergence will lead to a major rally. Divergence only indicates that price and momentum are behaving differently. It does not provide certainty about the size, timing, or direction of the next move. Markets can produce multiple divergences before a genuine reversal occurs.
Another mistake is ignoring the larger trend. A trader may see bullish divergence on a short timeframe while the daily or weekly chart remains strongly bearish. In such cases, the signal may represent only a temporary bounce. Traders should also avoid forcing divergence onto insignificant swing points. Clear, well-defined price lows generally provide more useful information than arbitrary points chosen to make the indicator appear divergent. Reviewing common technical analysis mistakes can help traders build more disciplined chart-reading habits.
Bullish Divergence and Risk Management
Even a well-defined divergence can fail, which makes risk management essential. Traders should determine their acceptable risk before entering a position rather than deciding after the market moves against them. Stop-loss levels, position sizing, and overall portfolio exposure can all influence the potential impact of a failed trade.
For example, a trader identifying bullish divergence near a support level might place a risk limit below the structure that invalidates the setup. If price breaks decisively below that level, the original reasoning may no longer apply. Position size should also reflect the distance to the risk level. Traders should never assume that a technical pattern removes market risk. A broader risk management strategy for traders can provide useful context for managing individual setups while protecting the overall portfolio.
Is Bullish Divergence a Reliable Trading Signal?
Bullish divergence can be useful, but reliability depends heavily on context. It is best understood as a momentum warning rather than a prediction. The quality of the swing points, timeframe, market trend, support or resistance, trading volume, and confirmation method can all influence how traders interpret the pattern.
The strongest approach is usually to combine multiple pieces of evidence rather than depend on one indicator. For example, regular bullish divergence near established support, followed by a resistance breakout and improving volume, provides a more complete technical picture than divergence alone. Traders should also test their strategy over historical data and understand its limitations before risking real money. No technical indicator can guarantee a profitable outcome, and past chart behavior does not ensure future results.
Frequently Asked Questions
What does bullish divergence mean?
It means price makes a lower low while a momentum indicator makes a higher low, suggesting that downward momentum may be weakening.
Is bullish divergence a buy signal?
Not by itself. Traders often wait for confirmation from price action, support, resistance, volume, or another technical indicator.
Which indicator is best for bullish divergence?
RSI is widely used, while MACD and Stochastic Oscillator can also help identify divergence. There is no universally best indicator.
What is hidden bullish divergence?
Hidden bullish divergence occurs when price makes a higher low while the indicator makes a lower low. It is commonly viewed as a potential bullish trend-continuation signal.
Can bullish divergence fail?
Yes. Price can continue falling after divergence appears. This is why confirmation and proper risk management are important.
Conclusion
Bullish divergence is a useful technical analysis concept for spotting situations where falling prices are no longer being fully supported by weakening momentum. By comparing price lows with indicators such as RSI or MACD, traders can identify potential changes in market strength before they become obvious in the price itself.
The key is to avoid treating divergence as a guaranteed reversal signal. Combining it with market structure, support and resistance, volume, confirmation signals, and sensible risk management can create a more disciplined approach. If you are learning technical analysis, continue with a complete guide to chart patterns and practice identifying divergence across historical charts before applying the concept to live trading.