

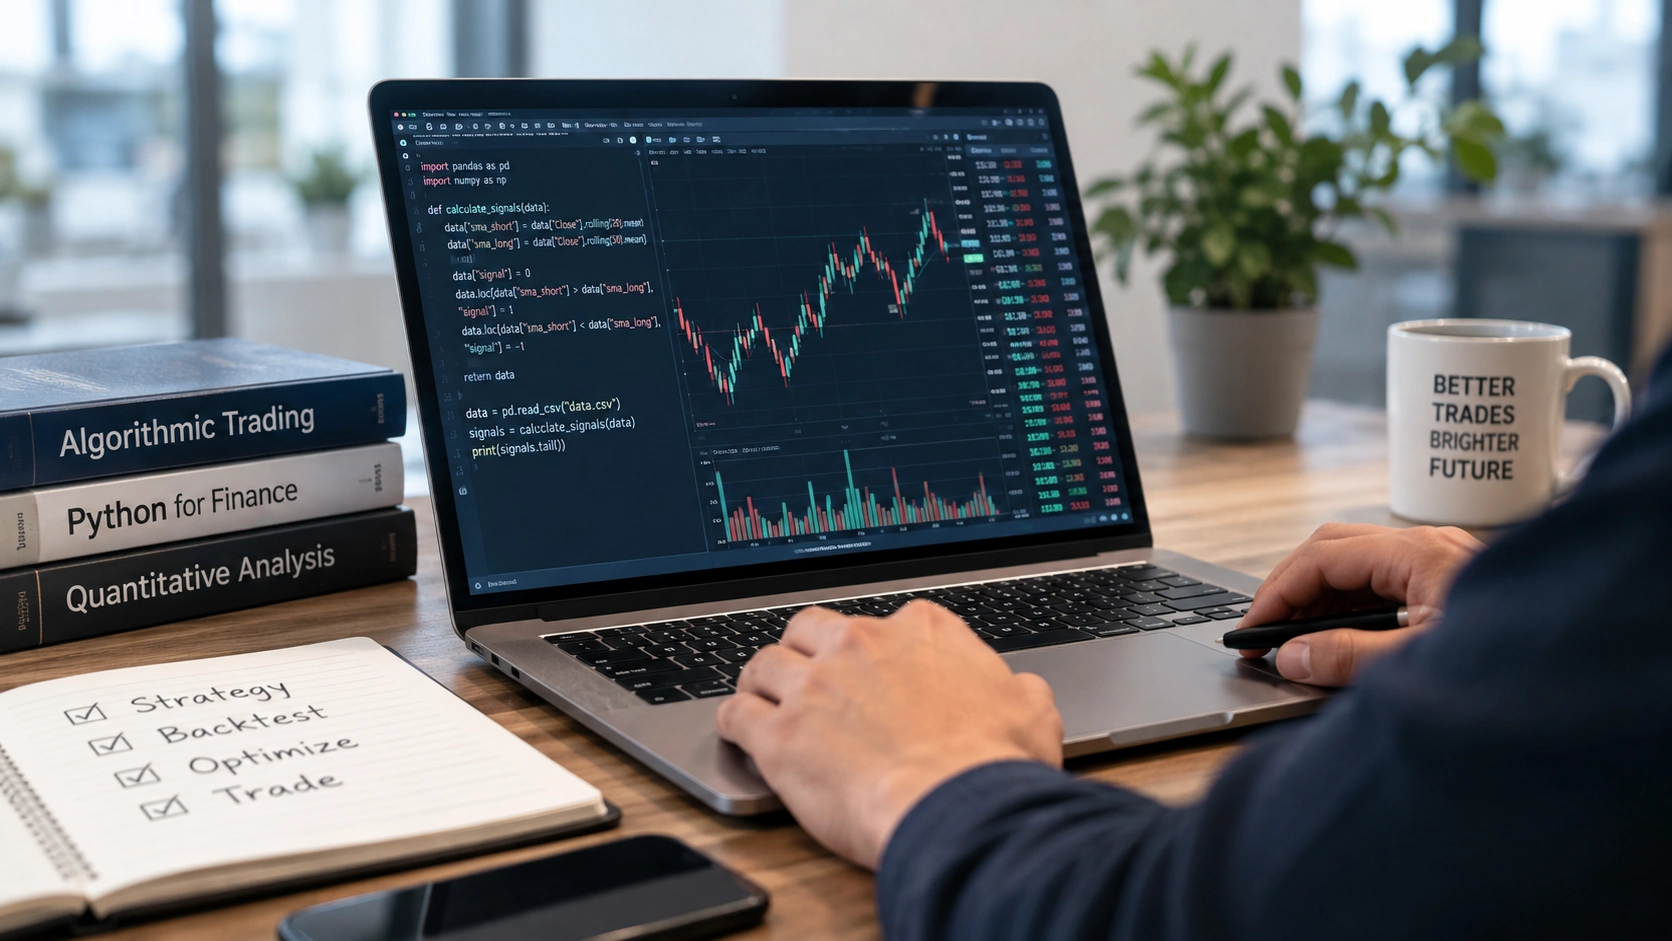
Quant trading is a method of buying and selling financial assets using mathematical models, statistical analysis, and computer programs. Instead of relying only on personal judgment, quantitative traders use data to identify trading opportunities and manage risk. These systems can analyze large amounts of market information, test strategies, and execute orders according to predefined rules. Quant trading is used in stock markets, foreign exchange, futures, and cryptocurrency markets. However, it is not a guaranteed way to make money. Successful quantitative trading requires a strong understanding of markets, reliable data, programming skills, and careful risk management. This guide explains how quant trading works, what beginners need to learn, and the challenges involved in developing a practical trading strategy.
What Is Quant Trading?
Quant trading, short for quantitative trading, is an approach that uses mathematical and statistical methods to make trading decisions. A quantitative trader may study price movements, trading volume, volatility, correlations, or other market data to identify patterns. These observations are then converted into rules that a computer can follow. For example, a strategy might buy an asset when its short-term moving average crosses above its long-term moving average and sell when the opposite signal appears. The rules can be tested using historical data before being considered for live trading. Unlike discretionary trading, which depends heavily on human interpretation, quant trading emphasizes systematic decision-making. However, a model is only as useful as its assumptions, data quality, and ability to handle changing market conditions.
Quantitative trading does not always require high-frequency trading or expensive institutional technology. A beginner can create a simple strategy using historical stock prices, a spreadsheet, or a basic Python program. Professional firms may use advanced statistical models, machine learning, and specialized trading infrastructure. The underlying principle remains similar: define a measurable trading idea, test it, and evaluate its results after accounting for costs and risk. For example, a trader might investigate whether a stock that falls sharply over several days tends to recover over the following month. The trader could then create rules around that observation and test them across different market periods. This process helps replace vague assumptions with evidence-based analysis.
How Does Quant Trading Work?
The first stage of quant trading is collecting and preparing financial data. Depending on the strategy, this may include historical prices, trading volume, corporate actions, economic indicators, or alternative data sources. The data must be checked for errors, missing values, and inconsistencies. A stock split, for example, can make historical prices appear to change dramatically if the data is not adjusted correctly. A quantitative model built on inaccurate information may produce misleading results. Traders also need to ensure that the data used in testing would have been available at the time each trading decision was made. This helps prevent look-ahead bias, a common problem in quantitative research. Good data preparation is often less exciting than building a model, but it is essential for meaningful results.
Once the data is ready, the trader develops a strategy and defines its rules. The strategy may use indicators such as moving averages, momentum, volatility, or statistical relationships between assets. A backtesting program then simulates how the strategy would have performed using historical market data. The results can include total return, maximum drawdown, number of trades, and risk-adjusted performance. For example, a model might show strong returns during a period of rising stock prices but lose money during a prolonged decline. That difference matters because a strategy should not be judged only by its best historical results. A useful quantitative process examines how the model behaves across different market conditions and whether its performance survives realistic trading costs.
Popular Quant Trading Strategies
Several strategy types are widely used in quantitative trading. Momentum strategies attempt to benefit from assets that continue moving in a particular direction. Mean-reversion strategies look for situations where prices may move back toward a historical average. Statistical arbitrage strategies examine relationships between related assets and attempt to profit when those relationships temporarily change. Other approaches include trend following, factor investing, and market-making. Each strategy has different assumptions and risks. A momentum model may struggle when markets move sideways, while a mean-reversion strategy may suffer when prices continue trending away from historical averages. Understanding these differences helps traders choose a method that matches their objectives and risk tolerance.
A simple example of quant trading is a moving-average crossover strategy. Suppose a trader tracks the 20-day and 50-day moving averages of a stock. The model generates a potential buy signal when the shorter average rises above the longer average and a potential sell signal when it falls below. This rule is easy to understand and program, but it does not guarantee profitable results. Signals may arrive after a large price movement, and frequent changes can create additional costs. A more advanced model might combine moving averages with volatility filters, position sizing, and a broader market trend indicator. The purpose of adding rules is not to make a strategy unnecessarily complicated, but to address specific weaknesses identified through testing.
Quant Trading Tools and Technology
Python is one of the most accessible programming languages for beginners interested in quant trading. It has libraries for data analysis, numerical calculations, statistical modeling, and visualization. Traders can use tools such as pandas for data manipulation, NumPy for numerical operations, and Matplotlib for charts. Backtesting frameworks can help simulate trades and evaluate strategy performance. A beginner does not need to master every library immediately. Learning how to import data, calculate indicators, create trading rules, and measure results is a practical starting point. Over time, traders can add more advanced methods as their understanding improves.
Professional quantitative firms may use additional technologies, including databases, cloud computing, real-time market-data feeds, and low-latency execution systems. Some strategies require rapid order placement, while others operate on daily or weekly data and do not need specialized infrastructure. The technology should match the strategy rather than the other way around. For example, a daily stock-selection model may run effectively on a personal computer, while a high-frequency strategy requires much more sophisticated systems. Beginners should also consider data subscription fees, brokerage costs, and software maintenance. These expenses can affect whether a strategy remains profitable after implementation.
Backtesting and Risk Management
Backtesting is a central part of quant trading because it allows traders to evaluate a strategy before risking real money. A backtest applies predefined rules to historical data and records the hypothetical trades. However, historical performance can be misleading if the model is overfitted. Overfitting occurs when a strategy is adjusted so closely to past data that it performs poorly on new information. For example, a trader might test dozens of indicator combinations and select the one that produced the highest historical return. That result may reflect random patterns rather than a genuine market advantage. To reduce this risk, traders can use separate training and testing periods, out-of-sample data, and walk-forward analysis. For more: Gurhan Kiziloz: Biography, Career and Business Journey
Risk management is equally important because even a well-tested strategy can experience losses. Traders may limit the amount of capital allocated to each position, diversify across assets, or reduce exposure during periods of high volatility. Maximum drawdown measures the largest decline from a portfolio peak to a subsequent low and helps show how difficult a strategy might be to maintain. A model with high returns but severe drawdowns may be unsuitable for someone with a low tolerance for losses. Quantitative traders should also consider liquidity risk, leverage, and the possibility that market conditions will change. A reliable strategy needs rules for both entering trades and controlling risk when its assumptions no longer hold.
Quant Trading vs. Traditional Trading
Quant trading and traditional discretionary trading differ mainly in how decisions are made. A discretionary trader may interpret price charts, news, economic developments, and personal experience before deciding whether to enter a position. A quantitative trader typically uses predefined rules and statistical evidence. Discretionary traders can respond flexibly to unusual events, while quantitative systems can process large amounts of data consistently. Both approaches involve uncertainty, and neither guarantees success. Some traders combine the two methods by using quantitative models to identify opportunities and human judgment to evaluate unusual market conditions.
The choice between these approaches depends on a trader’s interests, skills, and available time. Quant trading requires learning data analysis, programming, and statistical reasoning. Traditional trading may require more emphasis on market interpretation, decision-making, and emotional discipline. A person who enjoys building models may find quantitative research engaging, while another trader may prefer studying company fundamentals and economic news. There is also no requirement to choose only one method. A trader could use a quantitative stock-screening model to narrow the list of companies and then conduct additional research before making an investment decision.
Is Quant Trading Profitable?
Quant trading can be profitable, but profitability is not guaranteed. A strategy must identify opportunities that remain after commissions, spreads, slippage, and other costs. Even when a model performs well in historical testing, live results may differ because of changing market conditions, execution delays, and unexpected events. A strategy that works in one asset class may not work equally well in another. For example, a model designed for liquid large-cap stocks may produce unreliable results when applied to thinly traded assets with wider spreads. Quantitative traders therefore need to evaluate both the statistical performance of a model and the practical conditions under which it will operate.
Another important consideration is the difference between gross and net returns. A strategy may generate many profitable trades but lose much of its return through transaction costs. Suppose a model earns $2,000 in gross profits over a year but incurs $1,200 in commissions and slippage. Its net trading profit before taxes and other expenses would be only $800. This example shows why performance reports should include realistic costs. Traders should also compare results with an appropriate benchmark and examine whether the strategy offers a reasonable return relative to its risk. A positive backtest is only an initial research result, not proof of future income.
How to Start Quant Trading as a Beginner
Beginners can approach quant trading through a gradual learning process. Start by understanding basic financial markets, including how orders work, how prices are quoted, and how trading costs affect returns. Next, learn introductory programming and statistics. Python is a useful choice because it supports many financial research tasks and has a large collection of educational resources. After that, select one simple strategy and study its assumptions. Avoid building a complicated model before understanding how a basic strategy behaves. A clear, simple model is easier to test, explain, and improve.
A practical beginner workflow may include:
- Learn Python, statistics, and basic market concepts.
- Find reliable historical data for one asset class.
- Define a simple trading strategy with clear rules.
- Backtest the strategy using realistic assumptions.
- Check for overfitting and test on unseen data.
- Paper trade before considering live execution.
- Start with limited risk and track results carefully.
Keeping a research journal can help identify mistakes and document why changes were made. Beginners should also understand that paper trading cannot fully reproduce live execution, market impact, or emotional pressure. Moving from a backtest to real money should be treated as a separate stage of testing. The goal is to develop a repeatable process, not to chase the highest possible historical return.
Common Mistakes in Quant Trading
One of the most common mistakes is believing that a complex model must be better than a simple one. Additional indicators, parameters, and machine-learning features can make a strategy appear more accurate during backtesting while reducing its ability to perform on new data. This is why model simplicity, robust testing, and clear assumptions matter. Another mistake is ignoring the limitations of historical data. A backtest may fail to account for trading halts, unavailable liquidity, delayed information, or the difference between quoted and executed prices. These issues can make simulated results look more attractive than real-world performance.
Poor risk management can also undermine a sound trading idea. Some traders allocate too much capital to one strategy or use excessive leverage because a backtest showed relatively low volatility. Market conditions can change, and losses may occur more quickly than expected. Another common error is changing the model after every losing trade. Frequent adjustments can make it difficult to determine whether the original strategy had a genuine advantage. A better approach is to establish evaluation criteria before testing and review performance over a meaningful period. Quant trading works best when research, execution, and risk management are treated as connected parts of the same process.
FAQ
What is quant trading in simple words?
Quant trading uses mathematical rules, data, and computer programs to make trading decisions.
Is quant trading suitable for beginners?
Yes, beginners can learn it through basic programming, statistics, and simple strategy testing. Real-money trading requires additional preparation.
Do I need advanced mathematics for quant trading?
Basic statistics and algebra are useful at the start. Advanced strategies may require probability, optimization, and more complex mathematics.
Can quant trading make consistent profits?
Some strategies may be profitable, but no model guarantees consistent returns. Market conditions, costs, and execution affect results.
Is Python necessary for quant trading?
Python is not mandatory, but it is a popular and practical language for financial data analysis, backtesting, and automation.
Conclusion
Quant trading combines financial markets, mathematics, statistics, and programming to create systematic trading strategies. It can help traders analyze data consistently, test ideas, and reduce some forms of emotional decision-making. However, successful implementation requires more than a good-looking backtest. Reliable data, realistic trading costs, robust testing, and disciplined risk management are essential.
If you are interested in learning quantitative trading, start with one simple strategy and focus on understanding how it works. Build your programming and statistical skills gradually, test your ideas carefully, and avoid risking money before you understand the practical challenges. For more useful trading education, explore related guides on technical analysis, algorithmic trading, and risk management.
1 Comment